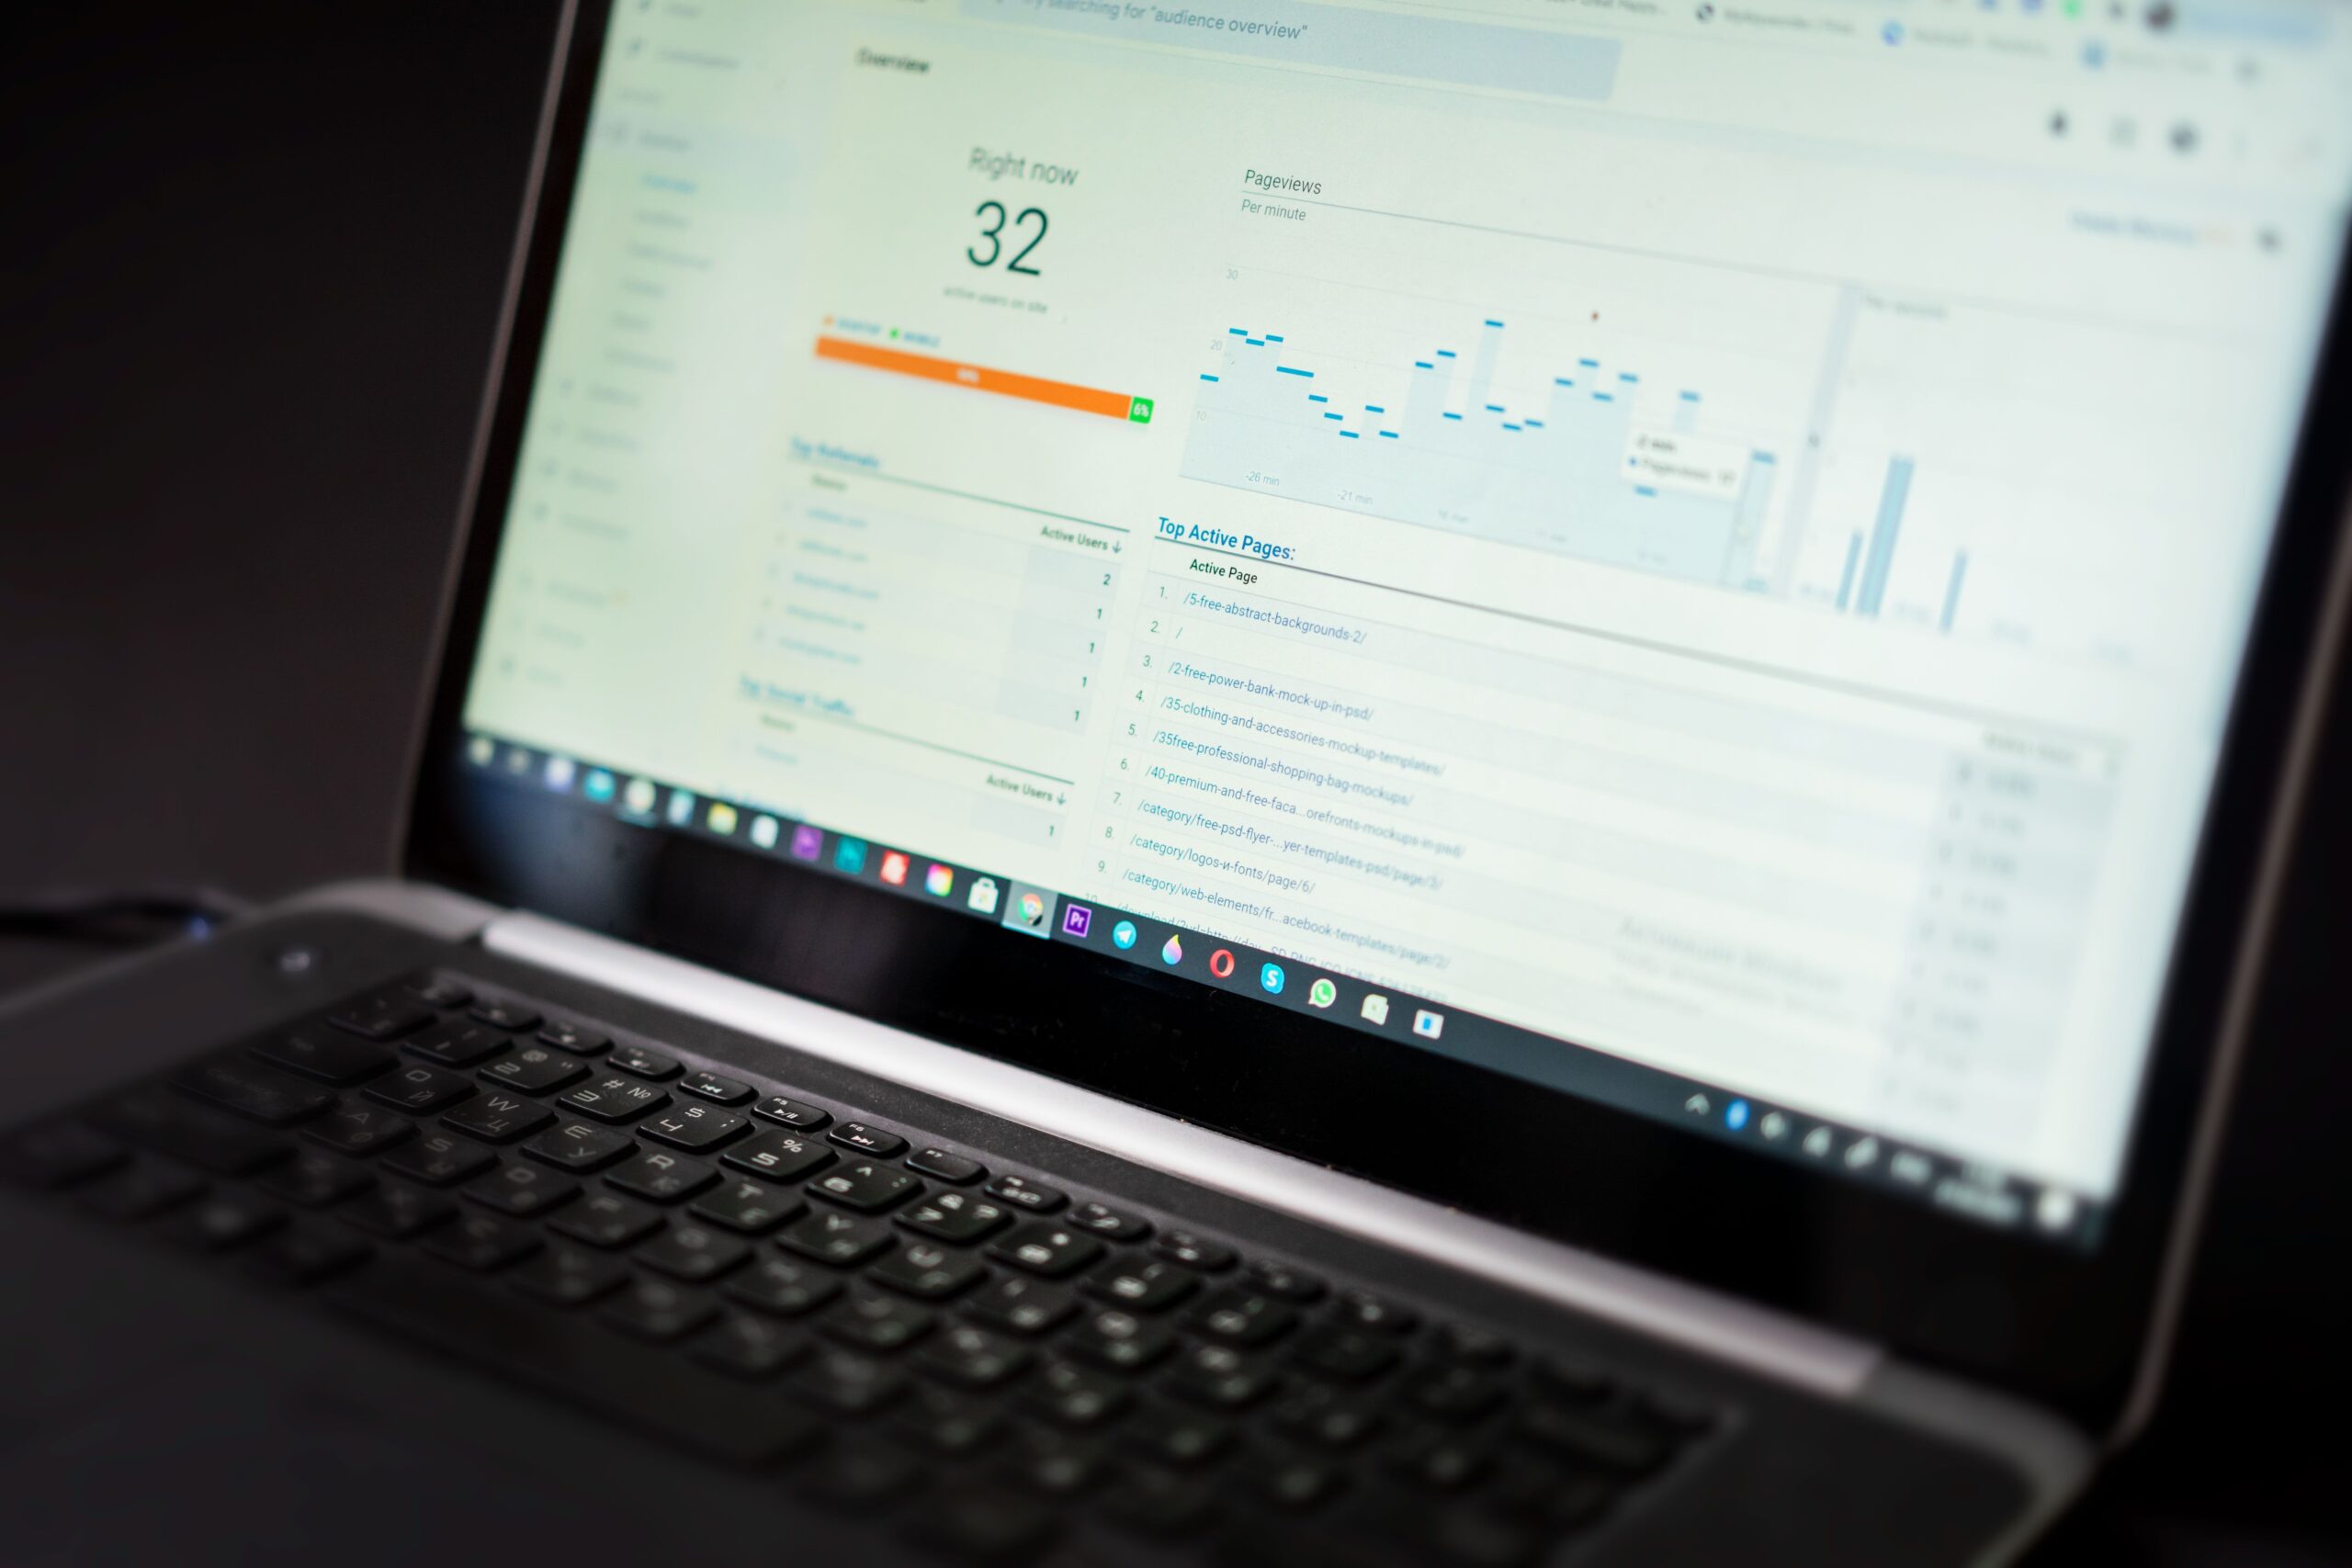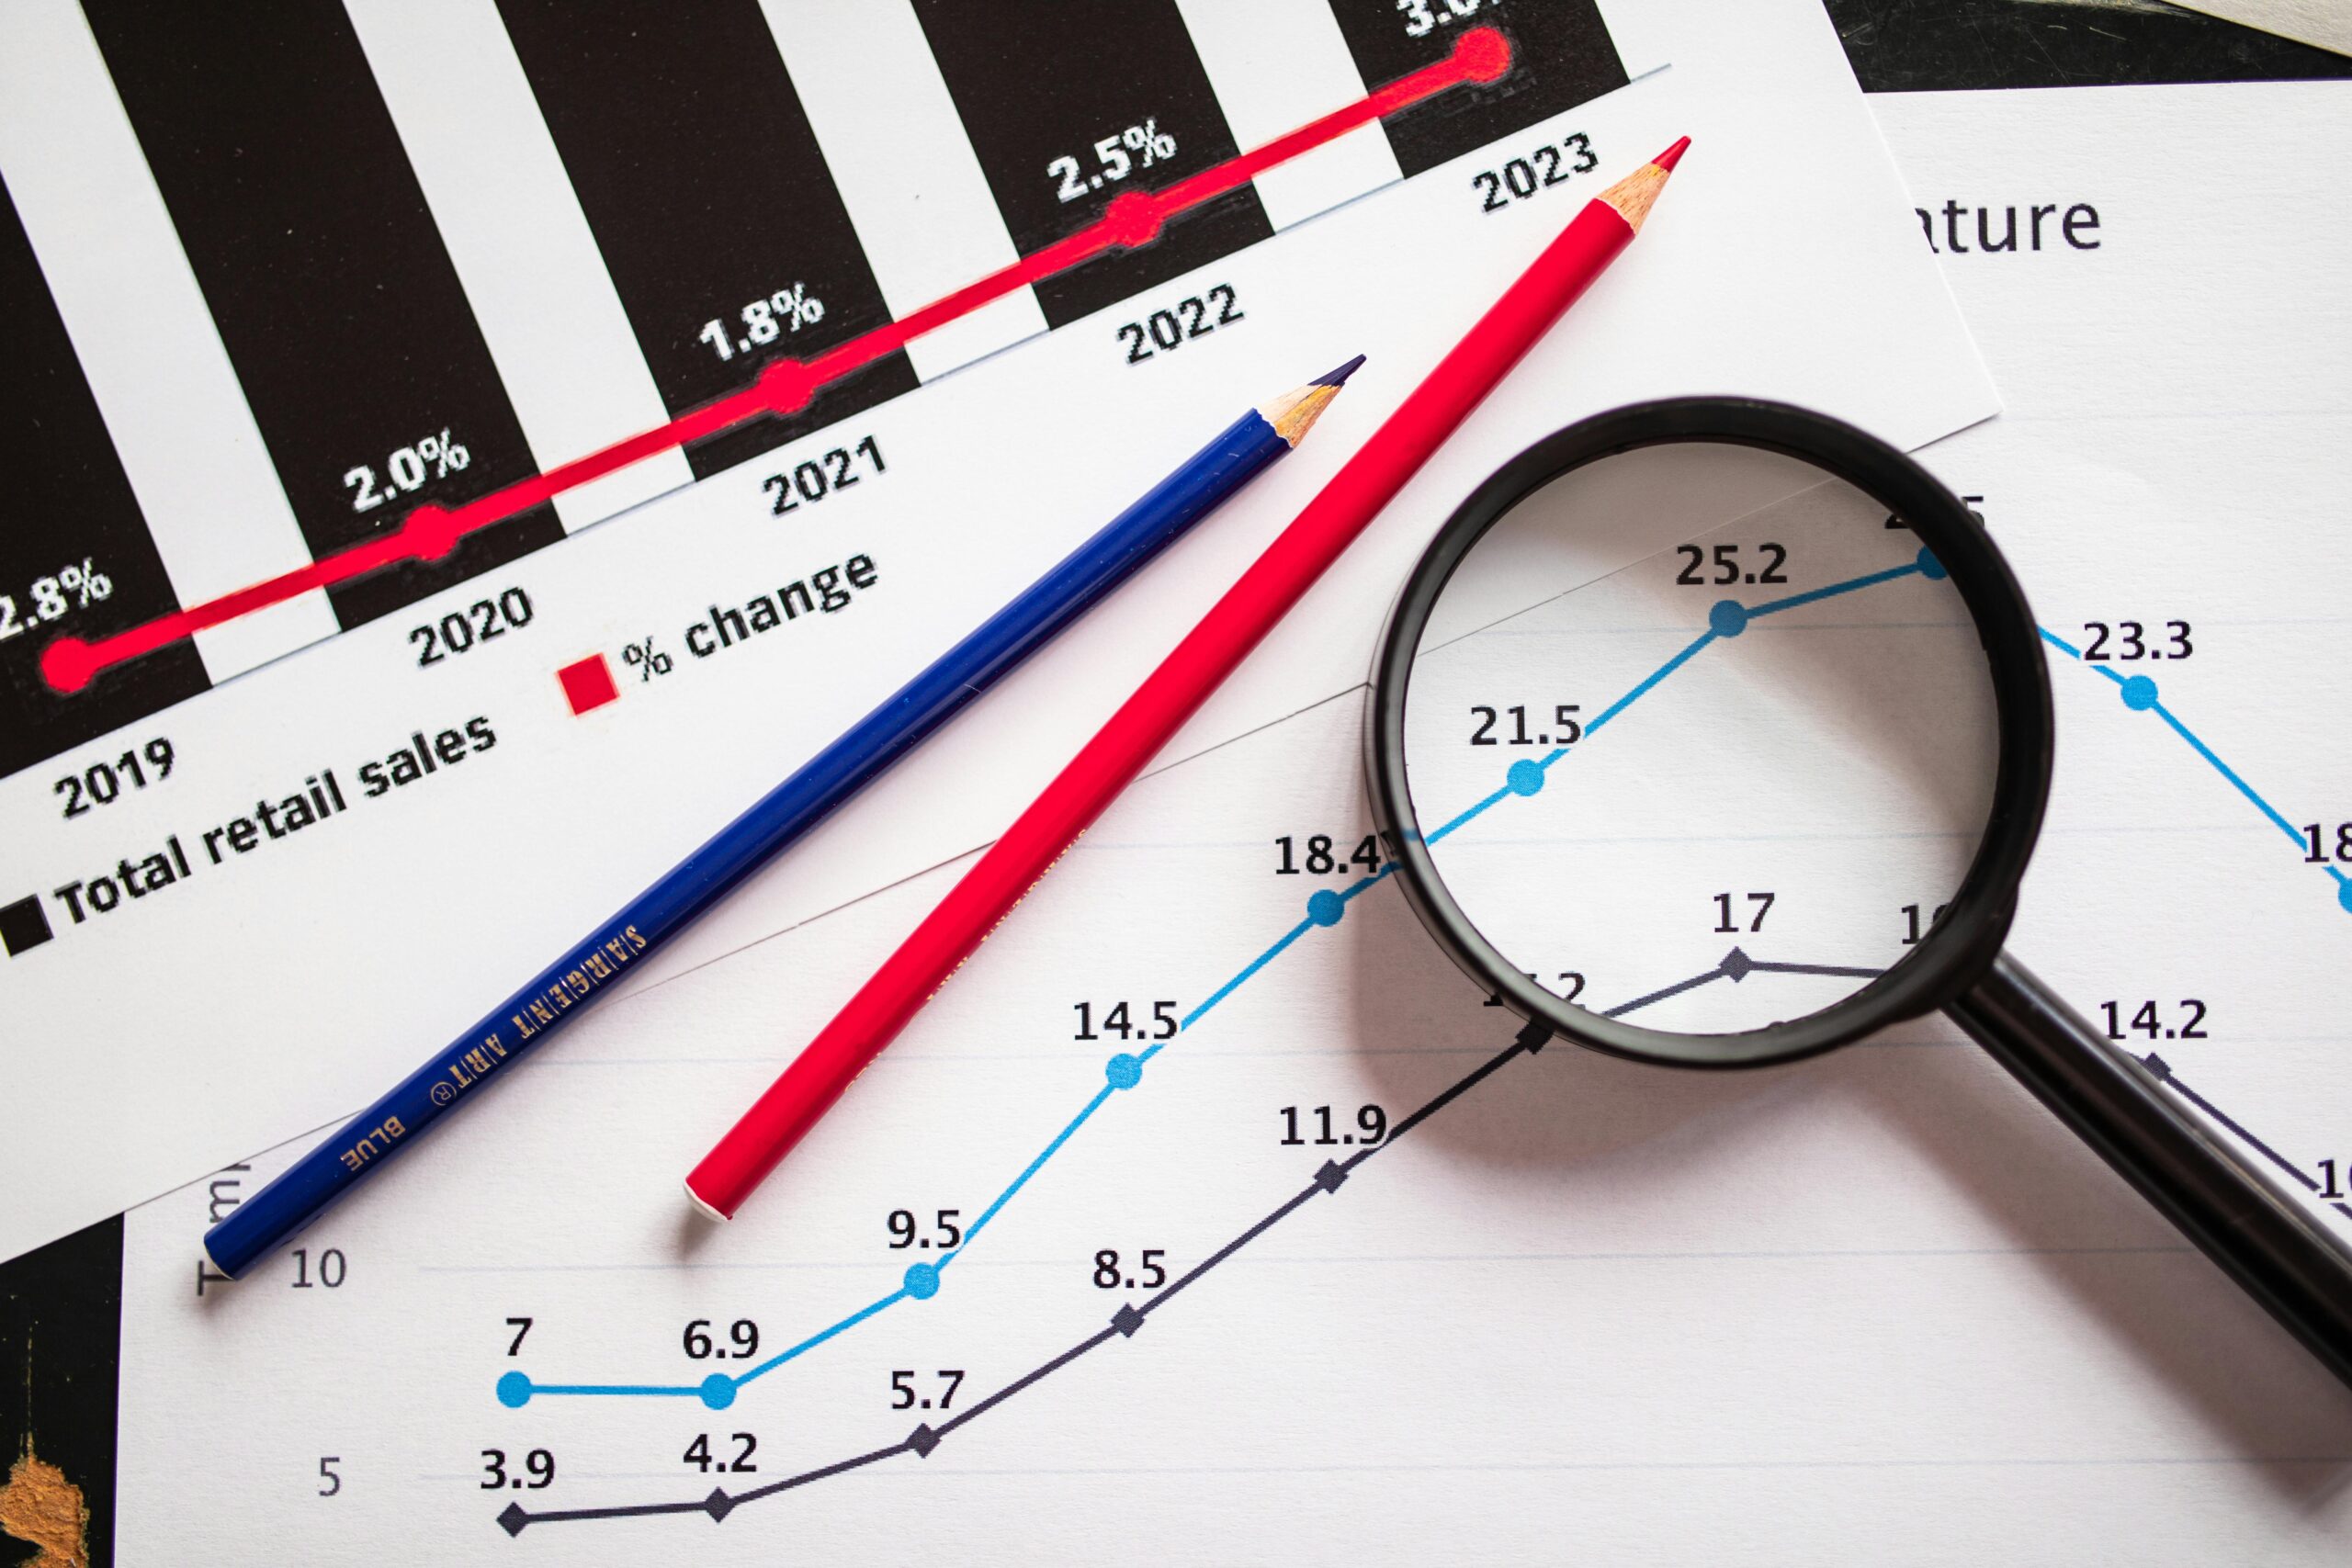
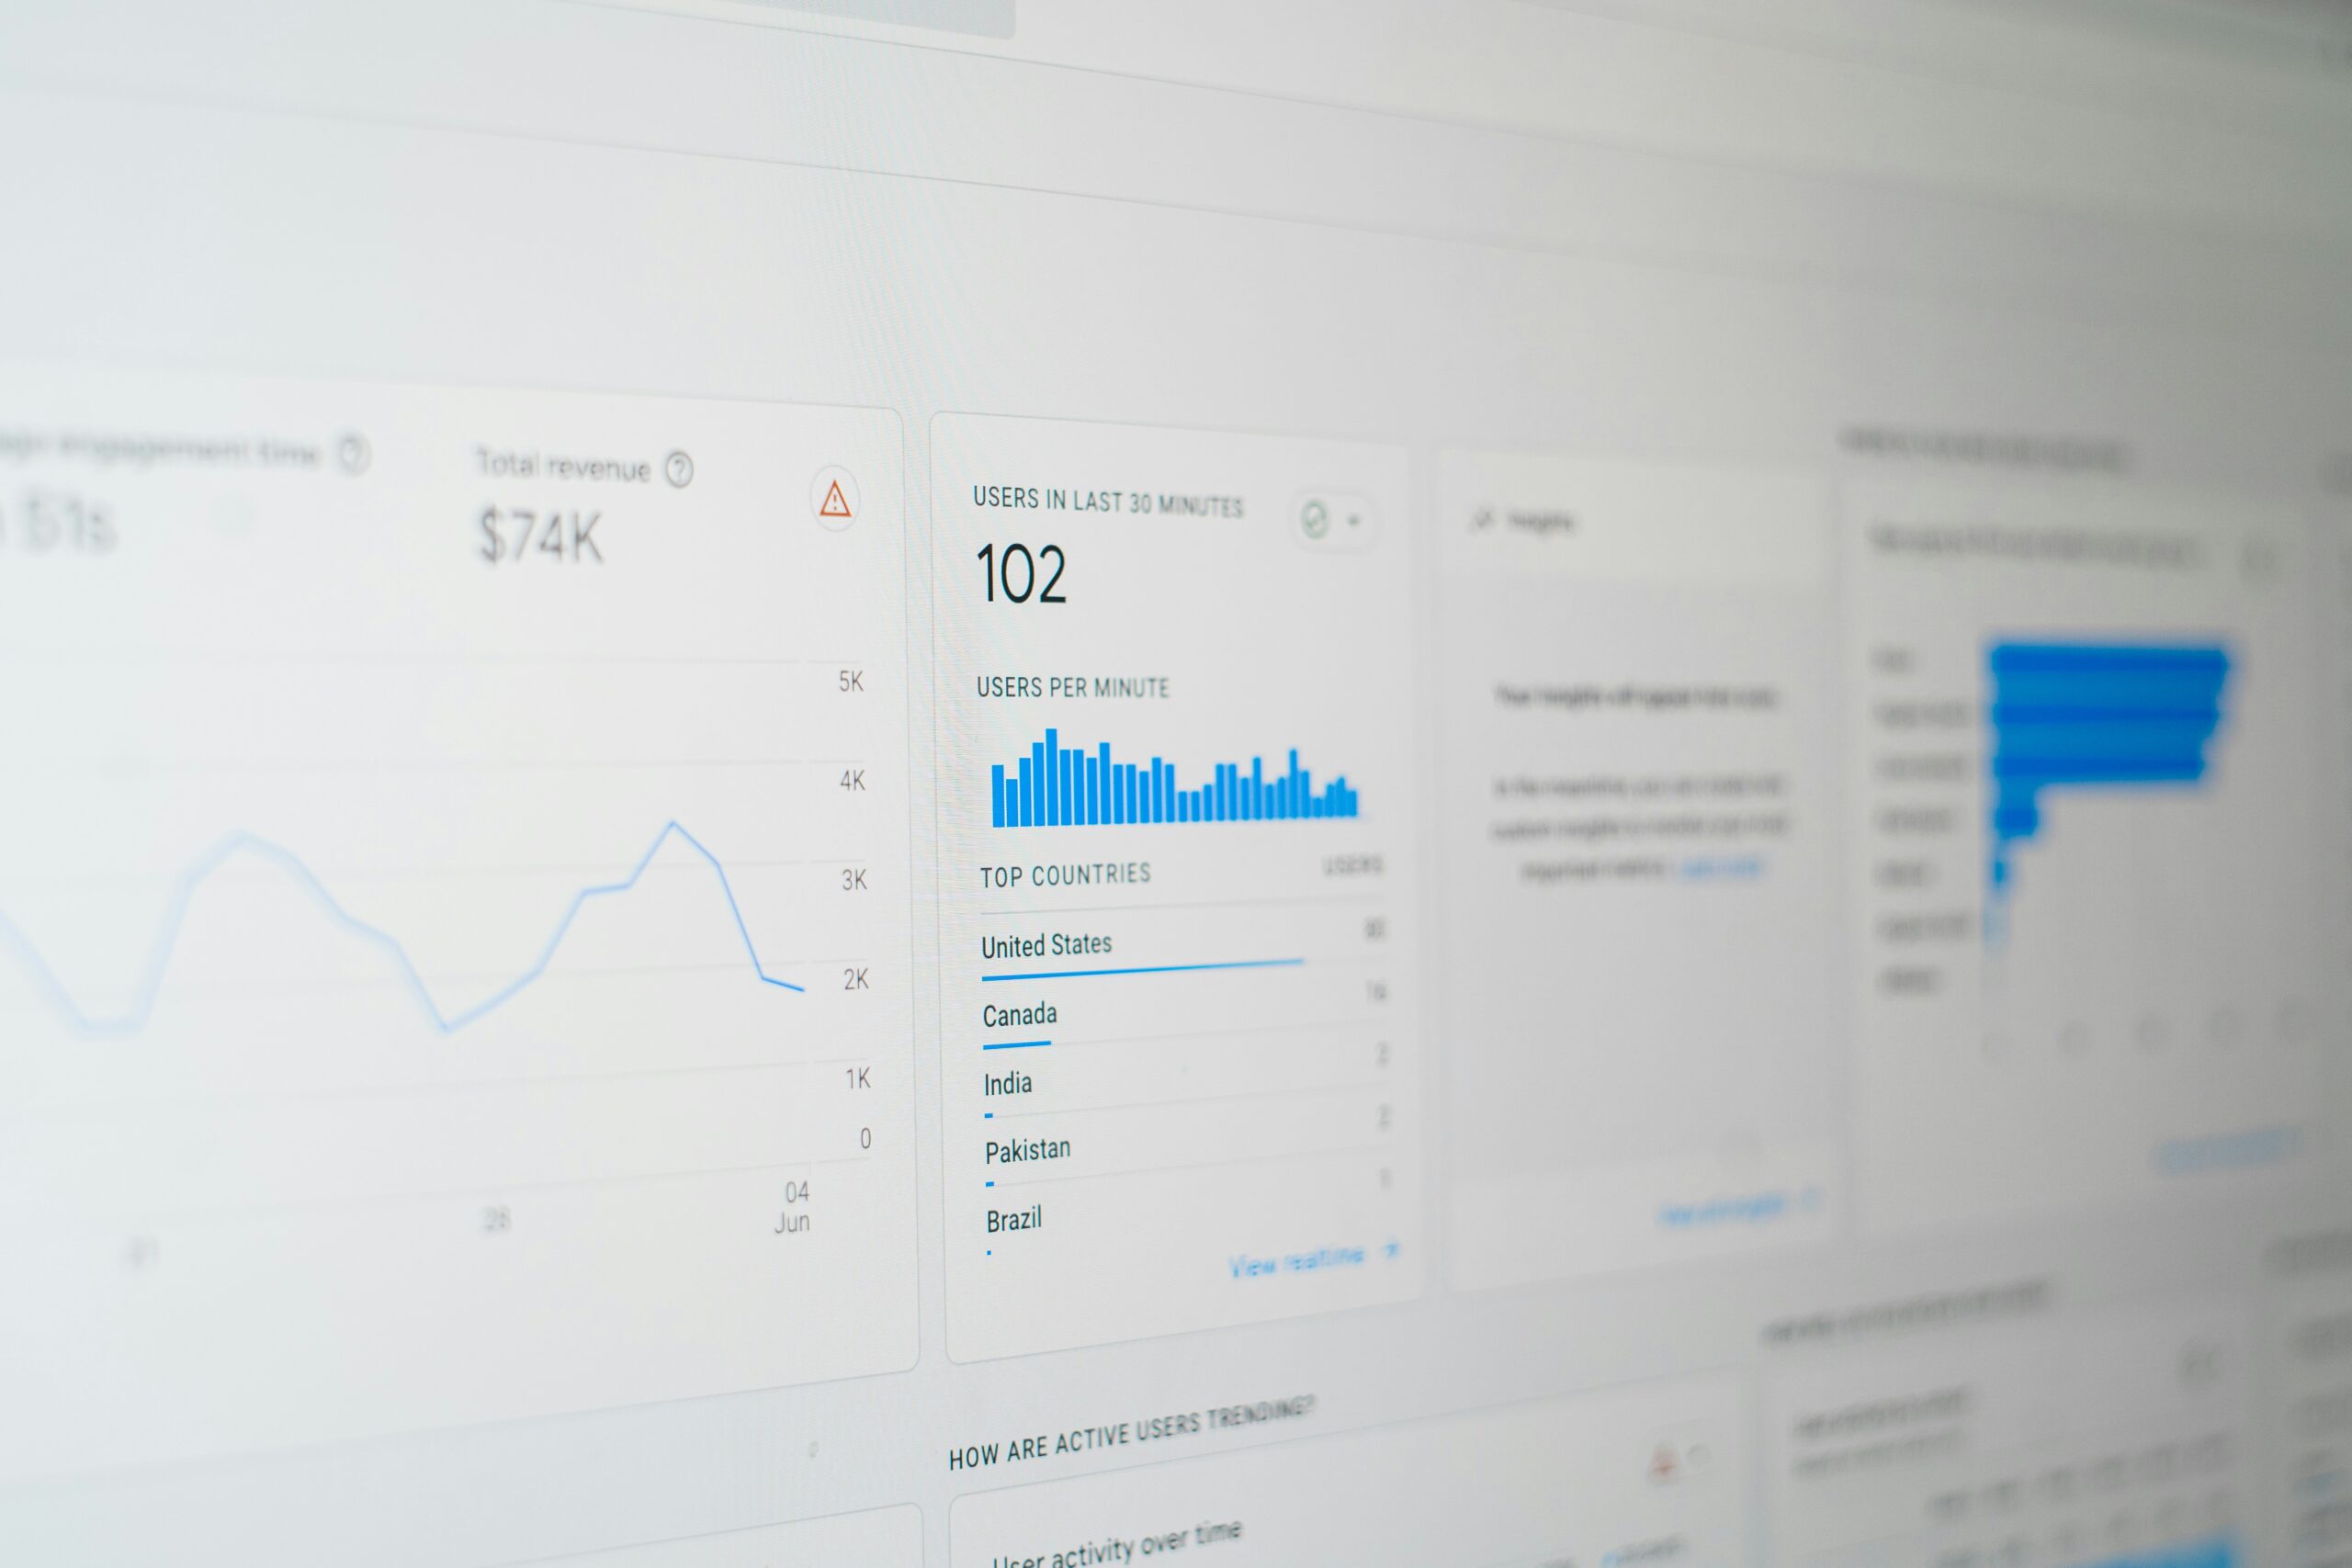
A project dashboard should do more than tell executives whether work is green, yellow, or red. Effective project dashboards connect performance signals to decisions, ownership, and action. That distinction matters because reporting activity is not the same as controlling performance.
The ROPE Framework treats dashboards and status reporting as part of project communication and stakeholder engagement. The objective is to provide useful visibility into project health while supporting the conversations needed to keep execution moving.
Measure What Requires a Decision
The best KPI is not necessarily the most sophisticated metric. It is the metric that exposes a condition requiring attention.
ROPE provides a practical example in data center migration. Its KPI approach includes measures such as unplanned downtime, unauthorized migrations, missed user notifications, and major incidents following migration. These measures connect performance directly to business impact rather than simply counting completed tasks.
That creates a useful test for any PPMO KPI: What happens when this number moves? Who acts, and by when?
If the answer is unclear, the organization may be measuring activity rather than performance.
From Status Reporting to Performance Control
A mature PPMO can establish a simple chain:
Metric → threshold → owner → action → governance decision → trend
This turns reporting into a living control. A deteriorating schedule metric should prompt a conversation about capacity, dependencies, scope, or risk. A budget variance should have an accountable owner and response. A worsening risk trend should change the leadership conversation before the risk becomes an issue.
The ROPE PMO runbook describes portfolio visibility, transparency, and predictability as core sources of PMO value. It also calls for objective reporting based on facts and data to support informed decision-making.
This is where many dashboards miss the mark. A page full of charts can create the appearance of control without actually improving control. The test is simpler: Does the information cause the right person to make the right decision at the right time?
Make the Dashboard Part of the Cadence
A dashboard should not live separately from governance. It should feed the operating rhythm.
ROPE’s PMO model includes recurring portfolio governance, demand management, team coordination, status reporting, and dashboard use. This creates a feedback loop in which information is reviewed, decisions are made, actions are assigned, and performance is observed again.
For executives, this means less time interpreting project narratives and more time addressing exceptions, tradeoffs, and decisions. For project managers, it means reporting has a clear purpose: maintaining shared visibility and enabling action.
Conclusion
A dashboard earns its place in the PPMO when it changes behavior. The objective is not to produce more charts or status reports. It is to give leaders a concise, trusted view of where intervention is needed, give owners clear accountability, and create a feedback loop that improves execution.
That is the real value of project dashboards: turning performance data into an operating mechanism for better decisions.
Reference
Results Oriented Project Execution (ROPE) Framework: A Practical Approach to Successfully Completing Complex Projects and Programs | Paul Thompson | 2025
Managing a Data Center Migration Following the Results Oriented Project Execution (ROPE) Framework | Paul Thompson | 2026
Pulse of the Profession® 2024: The Future of Project Work | Project Management Institute | 2024
Why Complex Projects Fail: Best Practices Are Not Enough, System Thinking Gives Your Team the Edge | Project Management Institute | 2026